


UPDATE: 30,000 blacked out by snowstorm in Finland
Tens of thousands of households were without electricity on Friday as a result of a storm that dumped heavy snow across southern Finland and sent winds gusting up to 27 metres per second, felling trees and downing power lines.
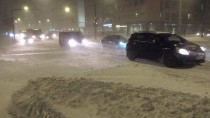
The first storm of the winter has caused difficulties for power companies. Image: Derrick Frilund / Yle
Around 10,000 Fortum, 11,000 Elenia, 8,000 Kymenlaakson Sahko and 3,000 Suur Savon Sahko customers suffered power cuts.
The affected areas are in Uusimaa, Hame, Pirkanmaa, Finland Proper, Kymenlaakso and South Savo. Fortum said that some of its customers in Porkkala, Kirkkonummi, Nummi-Pusula, Parainen and Salo were cut off, and that around 250 fitters were out working to restore supplies.
In Hame and Pirkanmaa around 10,000 Elenia customers lost electricity, with Hameenlinna and Urjala affected. Kymenlaakso saw 7,900 households lose connections to the grid, with a further 4,500 in South Savo cut off.
---------------
By P Gosselin on 29. November 2012
While UN climate scientists warn of an overheating planet and world leaders meet in suuny, warm Doha to hammer out an agreement to curb “global warming”, which hasn’t occurred in 16 years, the Northern Hemisphere and other parts of the world are shivering in extreme cold.
Snow, cold batter Northern Hemisphere.
Coldest UK winter in 100 years possible!
The online UK Telegraph here reports that “councils are gearing up for what could be Britain’s coldest winter in 100 years, as sub-zero temperatures and snow follow days of downpours that have devastated large parts of the country.”
The Telegraph warns that this weekend’s cold and snow could be around for awhile:
“The forthcoming cold snap, caused by clear skies and northerly winds, could herald the start of a freezing winter. There are reports that temperatures could fall as low as -20c in some areas in December and January.”
Cold, snow fly in the face of UN climate models
Cold and snow are forecast to hit Scandinavia and Central Europe as well, which all flies in the face of claims made by climate scientists just a few years ago, whose models predicted snow “would become rare, and a thing of the past.” The online The Local reports that northern Sweden Saturday “will see temperatures dip down to between minus 12 and 20 degrees Celsius”. Moscow forecasts it’s biggest November snowstorm in 50 years (hat/tip: Steven Goddard/).
As Alaska shivers, EPA threatens fines if people don’t stop burning wood!
In addition to Europe, Alaska and Canada have been enduring a long and bitter cold snap. Fairbanks, Alaska “has been experiencing unusually cold November weather with temperatures dropping into the minus-30s overnight”. The Fairbanks Daily News-Miner reports that the Fairbanks area air pollution sensors this week have recorded high particulate pollution levels from widespread use of wood and oil-burning stoves. As Alaskans burn wood and coal in a bid to keep warm, the EPA “has ordered the state to clean up Fairbanks air or face financial penalties”
------
Fairbanks Daily News-Miner: Think it’s cold now? Winter’s first cold snap hits FairbanksThursday marked the sixth day in a row the temperature at the airport didn’t climb above 10 below. Wednesday was the first day with a high temperature of 20 below or colder - it was 21 below - at the airport.
It was even colder in the eastern Interior, where a low of 52 below was recorded in Chicken on the Taylor Highway. A low of 44 below was reported in Eagle and Dry Creek. It was 43 below at Circle Hot Springs.The weekend forecast calls for lows in Fairbanks down to 45 below and highs in the 20 to 30 below range through at least Monday....Thoman said this November and last will be the coldest back-to-back Novembers on record. H/T Tom A. Nelson
---------
Record Arctic refreeze!
Meanwhile, the media are dead cold silent when it comes to the massive Arctic sea ice recovery seen since October 1st a record of almost 6 million square kilometers have been added. Never has the Arctic refrozen so much, so fast. Some experts are calling the scope of the refreeze “unprecedented” and “dramatic”. Even the other hemisphere as been too cold; Antarctica has seen above average sea ice extent for every month for the past year. The 30-year upward trend shows no sign of abating.
Also New Zealand, where it is now (tomorrow) summer, is forecast to get snow!
Snow, cold in India and Pakistan
Cold is also reported in India. The Hindu reports here:
“The entire tribal belt of Kinnaur, Lahaul-Spiti and Pangi, and Bharmour in Chamba district is reeling under a severe cold wave and may receive rain or snow at isolated locations in the higher reaches in next few hours.
The temperature in Kalpa was 1.4 degrees. It was three degrees in the tourist resorts of Manali and Bhuntar; four degrees in Solan and Sunderngar; five to seven degrees in Chamba, Shimla and Una; eight degrees in Dharamsala and 10 degrees in Nahan.”
With all the cold gripping the globe, clearly hundreds of millions could use a little global warming.
Tom A Nelson
Sunday, November 25, 2012
Unprecedented level of climate fraud?: Don’t miss this stunningly brazen warmist misuse of Newsweek’s 1975 “The Cooling World” article
Stephen Schneider: Climate Science and Media Distortion - YouTube
This video was screened before a live audience by Climate One of the Commonwealth Club in San Francisco on Dec 6, 2011 as the introduction to an event honoring Stephen Schneider and presenting an award in his name to Richard Alley, Professor of Geosciences and Associate of the EMS Environment Institute.
Also partially screened by Ben Santer at the 2011 AGU (American Geophysicists Union) Conference held in San Francisco
At the 15-second mark, Schneider says “How did we know in the 1970s pretty much what would happen, it was theory then...and since then, nature’s been cooperating with theory, but we kind of knew what was going to happen...”
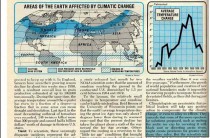
As Schneider is claiming that in the 1970s “we” knew that carbon dioxide would overheat the Earth, the following image is shown: look, it says “Climatic Change” there, and that portion of a graph appears to show rising temperatures!
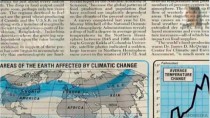
However, there is a big, big, big problem with using this image: It’s from a famous Newsweek article called “The Cooling World”, from April 28, 1975 (PDF here). Note that when you are allowed to see the entire graph (below), it shows plunging temperatures since the 1940s. Note that when you see the entire article, it contains a climate change “solution” that involves “melting the arctic ice cap by covering it with black soot”.
Credit for this propaganda video evidently goes to Climate One. Their email address is listed as ClimateOne@commonwealthclub.org. Contact them with your comments.
Update: Dr. Bob Carter on the science of climate change, and professional ethics
On November 22, 2012, CHUO 89.1 FM (Ottawa) The Train’s Denis Rancourt interviewed Dr. Bob Carter about climate science and professional ethics. This is one of the most lucid discussions by two scientists you will ever hear about the scientific basis of climate change.
------------
Media coverage of just what victims of Hurricane Sandy have been experiencing has been very limited. We haven’t seen much of how residents have been handled with regards to the Federal Emergency Management Agency (FEMA). However, there are stories that are coming in and with those stories come a lot of questions.
While there have been reports of “tent cities” set up, there has not been a lot reported on those “tent cities.” One resident was a bit upset and had a few choice words concerning the mishandling of things by FEMA. The Daily Sheeple reports that FEMA “...made an announcement that they were sending us to permanent structures up here that had just been redone, that had washing machines and hot showers and steady electric, and they sent us to tent city. We got f*****.”
In other tent cities the situations were as bad as some third world countries. Reuters reported:
One reason: the information blackout. Outside of the tightly guarded community on Friday, word was spreading that the Department of Human Services would aim to move residents to the racetrack clubhouse on Saturday. The news came after photos of people bundled in blankets and parkas inside the tents circulated in the media.
But inside the tent city, which has room for thousands but was only sheltering a couple of hundred on Friday, no one had heard anything about a move - or about anything else. “They treat us like we’re prisoners,” says Ashley Sabol, 21, of Seaside Heights, New Jersey. “It’s bad to say, but we honestly feel like we’re in a concentration camp.”
Sabol, who is unemployed and whose rental home was washed away in the hurricane, remembers being woken up on Wednesday at the shelter she was staying in at Toms River High School. Conditions there were “actually fine,” said Sabol.
Sabol was told that she had half an hour to pack: everyone was getting shipped to hotels in Wildwood, New Jersey, where they would be able to re-acquaint themselves with showers, beds and a door.
Sabol and about 50 other people boarded a New Jersey Transit bus, which drove around, seemingly aimlessly, for hours. Worse, that week’s Nor’easter snow storm was gathering force, lashing the bus with wind and rain.
After four hours, the bus driver pulled into a dirt parking lot. The passengers were expecting a hotel with heat and maybe even a restaurant. Instead they saw a mini city of portable toilets and voluminous white tents with their flaps snapping in the wind. Inside, they got sheets, a rubbery pillow, a cot and one blanket.
There was no heat that night, and as temperatures dropped to freezing, people could start to see their breath. The gusts of wind blew snow and slush onto Sabol’s face as her cot was near the open tent flaps. She shivered. Her hands turned purple.
It has taken three days for the tents to get warm.
There were reports that security guards were stationed all over, including in the showers. You couldn’t even go to the bathroom without an I.D. I’ll bet you could vote though.
One thing is for certain though, FEMA is demonstrating why it is no longer necessary and should be dismantled and defunded immediately. They cannot take care of this one incident despite expenditures over the previous decade. What am I talking about, you ask?
Well just what happened to hundreds of millions of emergency rations, blankets, and other supplies which were to be regionalized by the Department of Homeland Security?
However, it seems that DHS is perfectly set in purchasing billions in ammunition and putting tens of thousands of drones in America’s skies.
While some have viewed the reports of FEMA camps as conspiracy theory and ‘poo-pooed’ those who have investigated them, the truth is that FEMA camps are conspiracy reality and its documented by our own government here.
So the question remains, is FEMA just so inefficient that they could not pool enough resources together to do their job properly in New Jersey and New York City? That is highly likely. However, a report from Independence News reporter Gregor Deitrich provides the mindset of DHS. This was from 2010:
A phone interview with Sharon Bylier of The Dept of Homeland Security, revealed that H.S. is stepping up regionalizing disaster supplies. Simply put, they are taking emergency items that are currently centralized in Washington, D.C., and distributing them nationally. Sort of like a mobilization of supplies. Their plan is to complete the supply of fifteen H.S. warehouses around the country in the next three months. Ms. Bylier is quoted as saying “we have worked hard the last six months to meet our local objectives.” She continued “the goals of Homeland Security are in sight.” It’s difficult to know if this is a good or bad omen. No comment was offered as to why this program has been given so much urgency at this time. It’s nice to know we’re ready. But ready for What?
Exactly, what are they ready for? This report came two years prior to Hurricane Sandy and DHS was out of water within hours. So what exactly are they doing with all the stuff they are purchasing? One can only imagine, but if FEMA was no better prepared for Sandy than they were Hurricane Katrina, then we really need to start questioning the existence of such an agency and we need to find out where the resources they purchased, which could have been used during this disaster went to.
The lesson here is to never depend upon government. Depend on God, yourself, family and friends. It never hurts to be prepared for unexpected disasters
Read more.
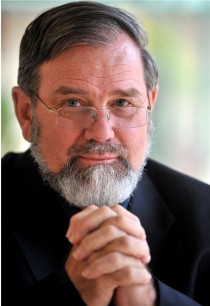
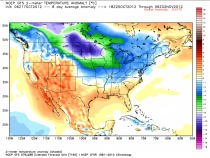
By Joseph D’Aleo, CCM
Here are two extremes. The Russians looking for Maunder Minimum and the NCAR grant fed researchers an 8F warming based on model of satellite data. I await reaction of Drs. Spencer and Christy on the latter. (Update: John Christy has responded - see below the WAPO story).
Bicentennial Decrease of the Total Solar Irradiance Leads to Unbalanced Thermal Budget of the Earth
Habibullo I. Abdussamatov, Pulkovo Observatory of the RAS
Applied Physics Research Vol. 4, No. 1; February 2012
Abstract
Temporal changes in the power of the longwave radiation of the system Earth-atmosphere emitted to space always lag behind changes in the power of absorbed solar radiation due to slow change of its enthalpy. That is why the debit and credit parts of the average annual energy budget of the terrestrial globe with its air and water envelope are practically always in an unbalanced state.
Average annual balance of the thermal budget of the system Earth-atmosphere during long time period will reliably determine the course and value of both an energy excess accumulated by the Earth or the energy deficit in the thermal budget which, with account for data of the TSI forecast, can define and predict well in advance the direction and amplitude of the forthcoming climate changes.
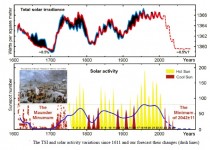
From the early 1990s we observe bicentennial decrease in both the TSI and the portion of its energy absorbed by the Earth. The Earth as a planet will henceforward have negative balance in the energy budget which will result in the temperature drop in approximately 2014. Due to increase of albedo and decrease of the greenhouse gases atmospheric concentration the absorbed portion of solar energy and the influence of the greenhouse effect It will additionally decline.
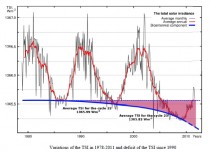
The influence of the consecutive chain of feedback effects which can lead to additional drop of temperature will surpass the influence of the TSI decrease. The onset of the deep bicentennial minimum of TSI is expected in 2042 plus or minus 11, that of the 19th Little Ice Age in the past 7500 years - in 2055 plus or minus 11.

After the maximum of solar cycle 24, from approximately 2014 we can expect the start of the next bicentennial cycle of deep cooling with a Little Ice Age in 2055 plus or minus 11. Thus, long-term variations of TSI (with account for their direct and secondary, based on feedback effects, influence) are the main fundamental cause of climate changes since variations of the Earth climate is mainly determined by a long-term imbalance between the energy of solar radiation entering the upper layers of the Earth’s atmosphere and the total energy emitted from the Earth back to space.
See full paper PDF.
-------------------------------------
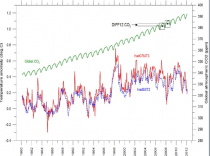
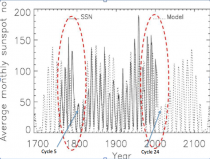
And the other polar opposite using models fed with satellite data by NCAR which by the way using models with proclaimed 97% accuracy predicted a record strong solar cycle for 24 with a max SSN of 169. The forecast was only100 off with the max at 66.9 so far and current 11 month means at 63.
Table from Solar Terrestial Activity Report
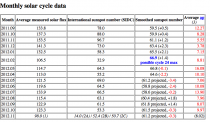
Enlarged
And remember the Layman’s Sunspot Count site which only counts spots larg enough to have been seen many decades ago so as to more acurately see trends.
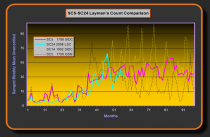
Enlarged
WARMER STILL: EXTREME CLIMATE PREDICTIONS APPEAR MOST ACCURATE, REPORT SAYS
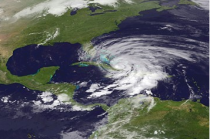
NOAA/REUTERS - Hurricane Sandy is seen churning northwards in this NOAA handout satellite image taken on October 25, 2012. According to climate scientists, the world could be in for a devastating increase of some eight degrees Fahrenheit by 2100, resulting in drastically higher seas, disappearing coastlines and more severe droughts, floods and other destructive weather.
Climate scientists agree the Earth will be hotter by the end of the century, but their simulations don’t agree on how much. Now a study suggests the gloomier predictions may be closer to the mark.
Warming is likely to be on the high side of the projections,” said John Fasullo of the National Center for Atmospheric Research in Boulder, Colo., a co-author of the report, which was based on satellite measurements of the atmosphere.
That means the world could be in for a devastating increase of about eight degrees Fahrenheit by 2100, resulting in drastically higher seas, disappearing coastlines and more severe droughts, floods and other destructive weather.
Such an increase would substantially overshoot what the world’s leaders have identified as the threshold for triggering catastrophic consequences. In 2009, heads of state agreed to try to limit warming to 3.6 degrees, and many countries want a tighter limit.
Climate scientists around the world use supercomputers to simulate the Earth’s atmosphere and oceans. Sophisticated programs attempt to predict how climate will change as society continues burning coal, oil and gas, the main sources of heat-trapping gases such as carbon dioxide. But these simulations spit out a wide range of warming estimates. All foresee an overheated planet in 2100, but some predict just three degrees of warming while others estimate eight or more degrees of extra heat.
“This problem has been around for 30 years,” Fasullo said. “As long as climate models have existed, there’s been this spread in projections of the future.”
One source of uncertainty involves the impact of cloud cover, especially clouds that form in the tropical and subtropical regions between about 30 degrees north and south of the equator. “Tropical clouds are so important to climate,” Fasullo said. “Small changes in clouds near the equator have a big effect on where you end up” for temperature predictions.
As sunlight pours onto the tropics, clouds bounce some of that heat back into space. Fewer clouds open up the atmosphere “like an iris,” Fasullo said, allowing more heat to beam onto Earth’s surface.
No supercomputer is powerful enough to predict cloud cover decades into the future, so Fasullo and colleague Kevin Trenberth struck on another method to test which of the many climate simulations most accurately predicted clouds: They looked at relative humidity. When humidity rises, clouds form; drier air produces fewer clouds. That makes humidity a good proxy for cloud cover.
Looking back at 10 years of atmospheric humidity data from NASA satellites, the pair examined two dozen of the world’s most sophisticated climate simulations. They found the simulations that most closely matched humidity measurements were also the ones that predicted the most extreme global warming.
In other words, by using real data, the scientists picked simulation winners and losers.
“The models at the higher end of temperature predictions uniformly did a better job,” Fasullo said. The simulations that fared worse ND the ones predicting smaller temperature rises “should be outright discounted,” he said.
The most accurate climate simulations were run by the United Kingdom’s Met Office, a consortium in Japan and a facility at the National Center for Atmospheric Research....
More.
------------------------------
REALITY CHECKS:
Note from Dr. John Christy
Joe:
Simple answer. When it comes to global temperature, the most sensitive models are the worst. Fasullo and Trenberth picked a rather obscure variable to hype, but when looking at the temperature itself, the worst models are the most sensitive models (attached, from my House testimony.)
John C.

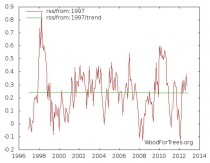
The real trend in global tempErature from satellite (RSS) for the last 15 years is flat while these ‘skillful’ models predicted a steep rise.
As is the Hadley data (used by the IPCC).
Enlarged
And the CFS unadjusted surface data since 1979 (Maue Weatherbell)

So why the constant push to manipulte data and hype natural disasters as proof that fossil fuels and man are responsible. Their own words tell us:
Maurice Strong, senior advisor to Kofi Annan, U.N. Secretary-General who chaired the gigantic (40,000 participants) “U.N. Conference on Environment and Development” in Rio de Janeiro in 1992 , who was responsible for putting together the Kyoto Protocol with thousands of bureaucrats, diplomats, and politicians, stated: “We may get to the point where the only way of saving the world will be for industrial civilization to collapse...isn’t it our job to bring that about”
“In searching for a new enemy to unite us, we came up with the idea that pollution, the threat of global warming, water shortages, famine and the like would fit the bill....All these dangers are caused by human intervention...and thus the “real enemy, then, is humanity itself....believe humanity requires a common motivation, namely a common adversary in order to realize world government. It does not matter if this common enemy is “a real one or...one invented for the purpose.” Quote by the Club of Rome.
Timothy Wirth, U.S. Undersecretary of State for Global Issues, seconded Strong’s statement: “We have got to ride the global warming issue. Even if the theory of global warming is wrong, we will be doing the right thing in terms of economic policy and environmental policy.”
“The data doesn’t matter. We’re not basing our recommendations on the data. We’re basing them on the climate models.” Prof. Chris Folland, Hadley Centre for Climate Prediction and Research
“The models are convenient fictions that provide something very useful.” Dr David Frame, Climate modeler, Oxford University
“It doesn’t matter what is true, it only matters what people believe is true.” - Paul Watson, Co-founder of Greenpeace”
“Unless we announce disasters no one will listen.” - Sir John Houghton, First chairman of the IPCC
“No matter if the science of global warming is all phony ... climate change provides the greatest opportunity to bring about justice and equality in the world.” - Christine Stewart, former Canadian Minister of the Environment
“The only way to get our society to truly change is to frighten people with the possibility of a catastrophe” - emeritus professor Daniel Botkin
”We are on the verge of a global transformation. All we need is the right major crisis.” - David Rockefeller, Club of Rome executive manager - Trustee of The Rockefeller Foundation a heavy funder of environmenal causes.
“This has almost nothing to do with environmental policy....one must say clearly that we redistribute de facto the world’s wealth by climate policy” - Ottmar Edehoffer, UN IPCC
----------------------
WARNINGS THIS WOULD HAPPEN
Eisenhower’s farewell address to the nation
“The free university, historically the fountainhead of free ideas and scientific discovery, has experienced a revolution in the conduct of research. Partly because of the huge costs involved, a government contract becomes virtually a substitute for intellectual curiosity. For every old blackboard there are now hundreds of new electronic computers.
The prospect of domination of the nation’s scholars by federal employment, project allocations, and the power of money is ever present - and is gravely to be regarded. Yet in holding scientific research and discovery in respect, as we should, we must also be alert to the equal and opposite danger that public policy could itself become the captive of a scientific-technological elite.”
---------
Vaclav Klaus, President of the Czech Republic, visited Australia in July 2011. In referring to the ideological orientations of those individuals and organisations who have significant financial and other vested interests in propagating the ‘Doctrine’ of anthropogenic induced climate change, President Klaus said: “They want to change us, to change our behaviour, our way of life, our values and preferences, they want to restrict our freedom because they themselves believe they know what is good for us. They are not interested in climate. They misuse the climate in their goal to restrict our freedom. What is endangered is freedom, the climate is okay.”
After noting that today’s human-induced climate change alarmists are the ideological descendents of the zero and negative population growth advocates of the 1970s who erroneously forecast that human population pressures would lead to increases in global poverty and growing shortages in resources, President Klaus went on to add: “They hate us, the humans, they consider us selfish and sinful creatures who must be controlled by them. I used to live in a similar world - called communism - and I know that it led to the worst environmental damage the world has ever experienced.”
By Jason Samenow
After one of the busiest years for tornadoes in 2011, tornado numbers in 2012 have come crashing down to historic lows.
In 2011, there were 1692 twisters - second most on record. This year, only 882 tornadoes have touched down. (Tornado records date back to 1950).
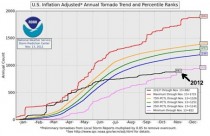
“[W]e are approaching a theoretical minimum in the annual tornado count for the modern era,” said Greg Carbin, warning coordination meteorologist at the National Weather Service Storm Prediction Center in Norman, Ok.
What’s especially remarkable about the year’s depressed numbers is that tornado activity got off to a red-hot start. Through mid-April, tornado counts were highest on record. But then, an extended tornado drought struck and the count ranking plummeted.
“[The] decrease in tornado activity coincided with the development of an extensive ridge of warm high pressure in the atmosphere across the western and central United States,” Carbin said.
He continued: “This high pressure area produced both record warm temperatures and extreme drought over much of the middle part of the continent into the summer and autumn. The high pressure also acted as a block in the middle and upper atmosphere with more transient but dynamic weather systems, that can lead to tornado development, being shunted northward into Canada.”
“Even when the high pressure weakened enough to allow for some of the more dynamic weather systems to move across the lower 48 states, shear in the atmosphere remained too limited to support more than isolated to occasional tornado events. These conditions didn’t result in a complete lack of severe weather as evidenced by the June 29 Derecho Event, it’s just that conditions supporting more widespread tornadoes were clearly suppressed by the large scale pattern.”
Although 6 weeks remain in 2012, it’s unlikely there will be enough tornado activity for the year to rise significantly in the historic rankings. November and December are the 3rd and 4th least active months of the year for tornadoes, with a combined average of 70 to 80 tornadoes.
Related: 2012 vs . 2011 tornadoes: A study in contrasts
* Because fewer tornadoes were detected in earlier decades compared to recent decades (because of lower population, less tornado awareness, and fewer observing networks), NOAA adjusts count estimates using a simple equation. More information.
But as the storm track shifted into Canada, our northern neighbor experienced a very active tornado season. The Weather Network reported Canada experienced more tornadoes in July than the entire U.S., with Saskatchewan the new tornado alley.
Saskatchewan has had upwards of thirty tornadoes this summer, with most happening in July. In a typical year, there’s an average of ten to twelve tornadoes in the province. What’s more, Saskatchewan alone had the same amount of tornadoes in July as the entire United States.
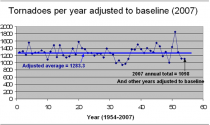
SPC has adjusted the tornado reports to account for increased population and improved detection. Removal of this upward trend is desirable because the increase in tornado reports over the last 54 years is almost entirely due to secular trends such as population increase, increased tornado awareness, and more robust and advanced reporting networks. By removing the upward trend and making the broad assumption that 2007 represents something closer to reality for annual tornado numbers, we can attempt to answer the question, “what constitutes a normal year with respect to modern-day tornado reports?”
THE next United Nations climate report will “scare the wits out of everyone” and should provide the impetus needed for the world to finally sign an agreement to tackle global warming, the former head of the UN negotiations said.
Yvo de Boer, the UN climate chief during the 2009 Copenhagen climate change talks, said his conversations with scientists working on the next report of the Intergovernmental Panel on Climate Change suggested the findings would be shocking. “That report is going to scare the wits out of everyone,” Mr de Boer said in the only scheduled interview of his visit to Australia. “I’m confident those scientific findings will create new political momentum.” The IPCC’s fifth assessment report is due to be published in late 2013 and early 2014.
Before then is the next end-of-year UN climate meeting in Doha, Qatar. Delegates will discuss a second commitment period for the Kyoto Protocol, the only legally binding accord to cut greenhouse gas emissions. Last December nations agreed in South Africa to work on a binding agreement that would cover all countries. That work is expected to continue until 2015. Mr de Boer, who is now special global advisor on climate change for KPMG, said the best prospect may be for nations to settle on targets that they write into their national laws, rather than a binding international deal.
The latter would be “almost impossible to get through the US Senate"” he said, no matter whether incumbent Barack Obama or challenger Mitt Romney wins the US presidential election.
“Slipped between our fingers”
Three years on from Copenhagen, Mr de Boer said he has neither nightmares nor withdrawal symptoms from those failed talks, which included a final 12-hour marathon of discussions behind closed doors with Mr Obama, former Australian prime minister Kevin Rudd and 23 other global leaders. “That was such a fantastic opportunity and it slipped between our fingers,” said Mr de Boer. “That’s my big frustration.”
He said Copenhagen’s legacy had changed political attitudes to climate talks.
“Most politicians will think twice about going to a climate event, and if they go again, they will be damned sure that they’ll be celebrating success rather than be associated with failure,’” he said. Expectations of global action on climate change have diminished, but Mr de Boer said it would still be “a very, very difficult conference” for his successor, Christiana Figueres.
He said the mandate for 2015 remained ambiguous and nations would be reluctant to sign up before they know what they were getting into.
The Kyoto Protocol has not been ratified by the US, and Canada, Japan and Russia have said they would not sign up to a second round when the current commitment lapses at the end of the year. Australia is yet to announce whether it will commit. Developing nations are holding back until they can see the rich acting.
They also want proof the UN’s Green Climate Fund - aimed at supporting efforts to counter climate change -will get the $US100 billion in government and private funding promised (by Hillary Clinton). He said superstorm Sandy may spur more Americans, and people elsewhere, to consider the risks of climate change, but warned: “It’s a bit like being shocked into stopping smoking when you’ve been told you’ve got terminal cancer.”
Read more here.
If you thought the War on Coal and various other job dampening EPA initiatives over the past few years were bad, apparently that was only a skirmish compared to what’s in store after this Tuesday. At the Examiner, Conn Carroll has the inside scoop on how Santa’s little elves at Obama’s Environmental Protection Agency have been very busy lately. But you might not care for the presents they have in mind for us all.
President Obama’s Environmental Protection Agency has devoted an unprecedented number of bureaucrats to finalizing new anti-coal regulations that are set to be released at the end of November, according to a source inside the EPA.
More than 50 EPA staff are now crashing to finish greenhouse gas emission standards that would essentially ban all construction of new coal-fired power plants. Never before have so many EPA resources been devoted to a single regulation. The independent and non-partisan Manhattan Institute estimates that the EPA’s greenhouse gas coal regulation will cost the U.S. economy $700 billion.
Carroll goes on to speculate that the mad dash is a result of panic at the agency over the possibility that Obama may lose the election. They would, in that case, have to rush out a bunch of regulations which, “would then be very hard for a President Romney to undo.”
I don’t tend to agree with that. It’s certainly possible that they could roll out some regulations in the next seven weeks, but shortly after President Romney is sworn in and put his own people in place at the agency, those could pretty well be swept aside at the stroke of a pen. (Or so I understand it, anyway.) I tend to think that this is preparation for a roll-out in the coming months in the event of an Obama second term, which is pretty much the analysis of Larry Bell at Forbes.
Titled “A Look Ahead to EPA Regulations for 2013: Numerous Obama EPA Rules Placed on Hold Until After the Election Spell Doom For Jobs and Economic Growth”, it lists and describes new rules concocted over the past year ranging from additional restrictions on greenhouse gas emissions, tougher water guidelines and tightening of the ozone standard. Taken together, they will further drive up pump prices, impose construction bans on local communities, and cripple oil, natural gas and coal production.
As the Washington Post notes, the report puts a spotlight back on the Obama EPA which has earned a “reputation for Abuse”, serving as a stark reminder that “President Obama has presided over a green team administration that works every day to “crucify” oil and gas companies and make sure that”....if you want to build a coal plant you got a big problem.”
Coal miners and coal powered plants already have a big problem, as we have pointed out repeatedly. But it looks like those problems may grow by several orders of magnitude in the coming months if the current White House occupant remains in office. The President has already been seen to bristle at criticism from his own Left flank over how he hasn’t done enough for the environmentalists who can’t understand why the oil companies are still in business four years later. Unrestrained by the need to win another election. having a lot more “flexibility,” as you might hear from Vladimir, these folks can really run amok.
If that’s what America chooses on Tuesday, then that’s what they’ll get. Higher gas, heating and energy prices, less jobs in an energy industry which can’t meet the demands place on them by the EPA, and everything that comes with it. But, as H.L. Mencken said, we all get the government we deserve.
------------
Giuliani: Where the hell are the generators?
BY ED MORRISSEY
The initial response to Hurricane Sandy appeared adequate, at the very least. All levels of government seemed engaged, first responders had the resources needed, and confidence was high that we could quickly address the immediate human needs and then shift quickly to rebuilding. Those hopes have vanished in a fumbled response at the local and federal levels. On the local level, Mayor Michael Bloomberg’s bizarre idea to keep the New York City Marathon in place while people on Staten Island can’t get water, power or heat has undermined confidence in his approach to the crisis - as Bloomberg himself discovered when attempting to meet and greet some of the locals (via NRO’s Eliana Johnson):
Storm-ravaged and weary Rockaways residents cornered Mayor Bloomberg yesterday to angrily demand more aid for their devastated neighborhood. “"When are we gonna get some help?” blasted one desperate woman, who had to be held back by the mayor’s security detail as Bloomberg stood by with a deer-in-the-headlights look. “When are we gonna get some f...king help?” she demanded.
“There’s old ladies in my building that don’t got nothing,” lashed out a man on video caught by a NY1 reporting crew.
Bloomberg’s trip to the Rockaways wasn’t announced and wouldn’t have been caught on cameras if the news crew hadn’t happened to run across him. Back in City Hall, he expressed sympathy with the residents plight. Bloomberg’’s predecessor doesn’t have much sympathy for him or for Barack Obama, either. Rudy Giuliani angrily castigated both for their inadequate response to the disaster. Where are the generators, Giuliani wondered - and the water?
At a Sunday gathering of Mitt Romney partisans in West Palm Beach, Florida, former New York City Mayor Rudy Giuliani delivered a blistering attack on President Barack Obama for what he said was a “disgraceful” response to Hurricane Sandy.
“Maybe the first day or two of the storm, the president did a good job,” Giuliani said. “The last three or four days? It’s disgraceful.” ((the President used it s a photo op before flying off to strategize with his lawyers in DC while pretending to oversee the FEMA response campaign (though he couldn’t manage a two car funeral) and then jetting off the Nevada to campaign (something he is very capable of).)
The Brooklyn-born firebrand excoriated the Federal Emergency Management Agency (FEMA) for neglecting to bring bottled water to the Northeastern U.S. during the days before the superstorm hit.
“It’s disgraceful what he’s done. It’s disgraceful what his FEMA has done,” Giuliani said. “There are people in New York City who don’t have bottles of water like this. See this little bottle of water? They dont have it in New York. You know why? Because Barack Obama’s FEMA didn’t think to pre-position it.”
“What - they didn’t learn anything from Katrina?” Breitbart has more on the water situation, and it’s as bad as Giuliani says. While FEMA administrator Craig Fugate told NBC that “We already had the water that was initially staged and based upon the demand that was there that the state had,” documents - and photos - paint a very different picture:
But contrary to Fugate’s claims, there simply was no “water that was initially staged” by FEMA. When the storm hit, all the FEMA bottled water was in its Georgia or Maryland warehouses. The request for proposal sent out hurriedly on Friday, November 2 for an additional 2.3 million gallons of bottled water, for delivery to Long Island on Monday, November 5, was not a pre-negotiated, pre-bid contract “turned on” that day according to a FEMA master plan. Instead, it was an example of FEMA scrambling after the fact to meet the needs of victims that it should have planned for weeks earlier.
In addition, Fugate’s claim that “once we go into response we have pre-negotiated, pre-bid contracts that are in effect, and we turn those contracts on and go to our vendors and say we want the water delivered at this rate to these locations,” is not supported by the facts surrounding the request for proposal that was made on Friday, November 2 upon which the Breitbart report referenced by NBC’s Klein was based.
Indeed, that request for proposal, which can be seen here, was an open bid available to any vendors interested in bidding. All of the vendors for the request for proposal, FEMA contracting officer Annette Wright told Breitbart News on Friday, “are currently being evaluated.” Presumably, the vendor was selected some time over the weekend so they could fulfill the delivery requirement of Monday.
The language of the request for proposal clearly stated that it was neither “pre-negotiated” nor “pre-bid” In fact, it was a hurriedly put together “open bid[."]
Giuliani told the West Palm Beach crowd that if this occurred while George Bush was President after the lessons of Hurricane Katrina, Congress would be impeaching him by now, and the media crucifixion would be well under way. It’s difficult to argue with that assessment.
While I am often humbled, when it comes to predicting the weather, I did correctly predict the fact that, when the inevitable happened, and a hurricane did clobber the East Coast, that certain individuals would use the event to promote their Global Warming Agenda.
Graphic from the August 21st 2012 story
The chief fact used, in the Alarmist argument about Sandy, is the simple truth the tide which New York City experienced during Sandy “beat the record.” This gives Alarmists the chance to dust off their favorite word, “unprecedented.” They love that word, because by suggesting something is, “without previous instance; never before known or experienced; unexampled or unparalleled,” they somehow manage to convince themselves it means something has gone haywire; something is dreadfully wrong.
There are two good ways to calm such people down. First, it is helpful to explain to them that every newborn child is “unprecedented,” and “without previous instance; never before known or experienced; unexampled or unparalleled,” because each newborn has fingerprints like none ever seen before on Earth. Therefore, there is no reason to panic. In fact, a new baby, and newness in general, is actually a delightful thing. Without newness life gets pretty darn boring.
In fact, that is why it is so much fun to try to predict the weather, even though you are bound to be humbled. Weather is always producing things never seen before. Weather is forever fresh and new.
The second way to calm down Alarmists is to point out hurricanes have happened before, and have actually been worse. Alarmists will then, of course, state no storm has ever been as bad as Sandy, for none had such a surge in New York. At this point you need to pat the back of their hand, say “now-now” and “there-there,” (and a few other anxiety-reducing things,) and ask them how much they know about the 1821 storm that set the “old” record.
Most Alarmists fail to study history much. Unfortunately, most don’t want to. They have their minds made up, because they hunger for an impossible thing called “closure,” which has a side effect of creating a closed mind. However if you coddle them, and ask them to “listen just to humor you,” you might get them to look at the history of the Great Gale of 1821.
Unlike Sandy, that hurricane didn’t dawdle. It came ripping up the coast, and was in and out of New York in a matter of hours. The people of the time reported a tide 13 feet above the ordinary high tide, but the best studies put the peak tide at 11.2 feet. Sandy reached 13.88 feet.
(You cannot fail to notice how much more scientific we have become. Back in 1821 they only measured a surge in tenths-of-a-foot. Now we measure in hundredths.)
Simple arithmetic suggests the 1821 storm’s high water was 2.68 feet lower than Sandy’s. However the interesting thing about the 1821 storm is that it came barreling through at dead low tide. Tides in New York vary roughly 6 feet between low and high tides.
Therefore, to be fair, it seems you should add six feet to the 1821 storm, if you want to compare that storm with Sandy’s surge at high tide. This would increase the 1821 high water to 17.2 feet.
On top of that, you have to factor in the influence of the full moon during Sandy. That adds an extra foot to the high tide. Add an extra foot to the 1821 score and you have 18.2 feet.
Joe D’Aleo at WeatherBELL.com brought up yet another fascinating factor: 1821 was at the end of the Little Ice Age, when a great chill had cooled the oceans. Because water contracts when it cools, the seas were roughly a foot lower back then. Therefore, to be fair, we need to add yet another foot to the 1821 storm, which gives us a total of 19.2 feet.
Joe Bastardi, also over at WeatherBELL.com, can do better than that. All you need to do is shift the track of the 1938 “Long Island Express” hurricane, with it’s last minute jog to the northwest, eighty miles to the West-by-West-southwest, and you have a storm surge of well over twenty feet surging up the Hudson River. That is practically a tsunami, and likely would reach Albany.
In other words, Sandy wasn’t so tough. In some ways, Sandy was a Wuss, and an imperfect storm, compared to 1821, which had wind gusts toppling chimneys in Philadelphia, entire houses in New York City, and flattening forests up through New England.
In conclusion, things could get a lot worse for New York City, even if storms are not a bit “unprecedented.” Things could be worse even if they are ordinary!!!!!
It helps a lot if you get a bit wild-eyed, as you say this. Alarmists are better able to listen to wild-eyed types, than they are able to listen to dull, factual sanity.
It might help even more if you grab them by the lapels and repetitively hoist them up and slam them down, launching into a rave. You’ll have to make up your own rave, (and it helps a lot if you practice the wild-eyes in a mirror beforehand,) but my own rave would be something like this:
“You stupid, ignorant, son-of-a-Susquash! We have known for decades New York’s subways would flood in a perfect storm. It was a real threat. Why didn’t we build flood-gates, to close up the subways in the face of storm surges or even earthquake tsunamis? Why did we waste billions on windmills and Solyndra?...”
You can move on from there, but in some cases all your efforts will be in vain.
Never stop trying, for you never know when an idiot might be redeemed, but don’t be discouraged if you fail, for in some cases explaining Truth to Alarmists is preaching to the mire.
Susanne Posel
“
A paper published in The Holocene shows that 3,200 years ago there were “extraordinary droughts and floods were parts of the [entirely natural] climate variability” in the Northwest region of China. This was during the mid-Holocene Climactic Optimum. It proves that during “safe” Co2 levels, the earth’s climate was erratic; just as it is today.
Modern day meteorologists are increasingly denying supposed evidence of global warming by alarmists. Only 19% of professional meteorologists believe in man-made climate change.
Klaus-Ekart Puls, physicist and meteorologist is one of those doubtful professionals. At the end of 2011, Puls made a presentation on sea levels at the 4th Climate Conference in Munich.
He has come forward to say that the assertion by the UN’s International Panel on Climate Change (IPCC) that by regulating CO2, we can “regulate” climate change is “sheer absurdity”.
Puls recalls that he used to just parrot whatever the IPCC told him, but when he investigated the facts behind their claims, he discovered there was no scientific data to support that CO2 or humans were the cause of climate change.
Puls said: “One day I started checking the facts and data, first I started with a sense of doubt but then I became outraged when I discovered that much of what the IPCC and the media were telling us was sheer nonsense and was not even supported by any scientific facts and measurements.”
According to Puls, climate change is normal as the planet goes through phases of climate warming “many that even far exceeded the extent we see today. But there hasn’t been any warming since 1998. In fact the IPCC suppliers of data even show a slight cooling”.
The IPCC claims that their projecting models indicate that there will be a 0.2 degrees Celsius warming trend per decade to culminate in 2 to 4 degrees Celsius rise by 2100.
Puls says that this assertion is based on “speculative model projections, so-called scenarios - and not prognoses. Because of climate’s high complexity, reliable prognoses just aren’t possible”.
While the CO2 debate lacks real world data entered into the projection models, the IPCC assumes that global warming is based solely on “speculative amplification mechanisms” which do not take into account actual empirical data.
CO2 levels have risen, and yet, the earth is in a cooling phase.
Puls agrees that sea levels have risen, however “it’s important to remember that mean sea level is a calculated magnitude, and not a measured one. There are a great number of factors that influence sea level, e.g. tectonic processes, continental shifting, wind currents, passats, volcanoes. Climate change is only one of ten factors”.
The IPCC says that the glaciers are melting because of climate change. Puls offers scientific observations that contradict their claims. “...the Antarctic ice cap has grown both in area and volume over the last 30 years, and temperature has declined. This 30-year trend is clear to see. The Amundsen Scott Station of the USA shows that temperature has been declining there since 1957. 90% of the Earth’s ice is stored in Antarctica, which is one and half times larger than Europe”.
Puls points out that when climate change alarmists cite the Wilkins-Shelf breaking off, they neglect to mention that this is a segregated area of a peninsula . The area totals less than 1% of the entirety of Antarctica. There are also massive westerly wind storms that plague this area. It is home to some of the most violent storms on the planet.
As the planet goes through cycles, ice sheets break off and reform naturally.
The Arctic ice has been measured to be melting and reforming for the past 30 years. Its lowest point was in 2007, and the sea levels were not severely affected, as climate change alarmists would have us believe.
Puls also notes that the deserts are not expanding, but actually the Sahara has been shrinking as an area the size of Germany has been lost in the Northern parts.
While there was devastating famine in Somalia, Kenya and Ethiopia, the cause was corporation’s usurpation of the land to grow crops for biofuel for Europe. Warring factions for control over land also played a significant role.
When governments and multi-national corporations destroy land, it is convenient to blame global warming on the destruction they cause.
When asked if there is anything we can do about climate change, Puls said: “There’s nothing we can do to stop it. Scientifically it is sheer absurdity to think we can get a nice climate by turning a CO2 adjustment knob. Many confuse environmental protection with climate protection. It’s impossible to protect the climate, but we can protect the environment and our drinking water. On the debate concerning alternative energies, which is sensible, it is often driven by the irrational climate debate. One has nothing to do with the other”.
HIGHLIGHTS
* New record storm surge for Battery
* Governor of NJ: “Damage to the Jersey coast is unprecedented.”
* Devastation to Long Island and southern New York City boroughs is widespread with 41 dead in the City alone
* Death toll has risen to at least 90
* Damage estimated now at least $50 billion dollars.
* Severe flooding and rescues continue in the NE part of New Jersey where levees were overtopped by the storm surge inundating three towns.
* 8.1 million people are now without power and estimated restoration times range from 7 days to over 3 weeks. Cold weather is coming
* 80 homes have burned in Queens, New York due to a fire started by arcing power line and then spread from house to house by strong winds.
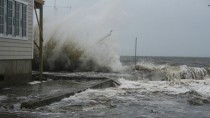
* Helicopter views of the New Jersey coast reveal incredible damage. Barrier islands have been cut in half in some places with structures heavy damaged and large 20-25 foot protective dunes completely gone.
* 90% of Hoboken, NJ has been flooded with sea water.
* NJ transit system will be closed until further notice due to damage. Damage to NYC transit system is extensive.
* Seaside Heights Boardwalk (Famous from MTV’s Jersey Shore) is gone
* The Jersey Coast and southern Long Island has been devastated
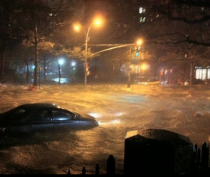
Lower East Side, Manhattan
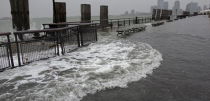
Water entering Battery Park where record tide level set in the evening
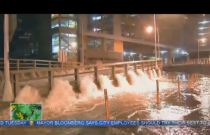
Water cascades like a waterfall into the Brooklyn Battery Tunnel
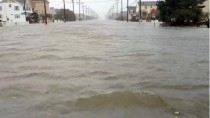
Flooding on the Connecticut shore
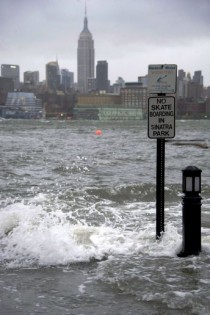
Hoboken New Jersey 13 foot surge
Beach Haven, Long Beach Island, NJ
Sandy came ashore in southern New Jersey, bringing 80-90-mph winds and a roiling wall of seawater as it moved inland and north toward New York City. It sent 90-mph gusts through the Wall Street canyons and water surging to a record 13 feet in Lower Manhattan, flooding the subway system and prompting Consolidated Edison to cut power to part of the area to avoid storm damage. Manhattan's FDR Drive was under water south of 20th Street. Water from West Street Cascaded like a "waterfall" into the Brooklyn Battery Tunnel. The Holland Tunnel was also said to be flooded. In a confirmation of the fears of Metropolitan Transportation Authority, subway tunnels and stations flooded Monday evening as water rushed through Battery Park and other areas.
The 13.88 foot storm surge at the Battery surpassed the old record of 11.2 feet in the great hurricsne of 1821. That 1821 hurricane's surge occurred at low tide. the surge in 2012 came at high tide and with a full moon. It has left behind flooded homes and businesses and 7 million without power. The New York City subway system “has never faced a disaster as devastating” as the damage that was caused by Superstorm Sandy, Metropolitan Transportation Authority chairman Joseph Lhota said Tuesday. Seven subway tunnels under the East River flooded Monday night as the MTA cut power to some subway stations Monday after water began pouring into the some of the stations and tracks.
Hurricane Sandy wreaked havoc on our entire transportation system, in every borough and county of the region,” Lhota said. Metro-North lost power from 59th Street to Croton-Harmon on the Hudson Line and to New Haven on the New Haven Line, Lhota said. The Long Island Rail Road had to evacuated its West Side Yards and suffered flooding in one East River tunnel. We’re seeing flooding pretty much throughout the entire area with most of the flooding we’re seeing in Lower Manhattan,” MTA spokesman Kevin Ortiz told CBS 2. The MTA has shut down power to the tunnels that run under the East River between Manhattan to Brooklyn. But flooding was still reported at several stations and tunnels. Ortiz said virtually all the stations and tunnels south of Chambers Street were flooded. In Queens, the Rockaway Park A station was also inundated, with water reaching the platform. Crews were working with portable pumps to get the water out as quickly as possible, but the flooding is not good news when it comes to reopening the subway system. It is really difficult to predict the amount of time to pump the water out from flooded tunnels and adjoining stations,” Ortiz said. MTA officials said previously that salt water could corrode the switches and signals in the system and could force the MTA to replace hundreds of pieces of equipment before service could be restored.
But even before the MTA gets to restoring the signals, it could be as few as 14 hours and as much as four days before all the water is even pumped out, Ortiz said. Gov. Andrew Cuomo and MTA officials have repeatedly emphasized that salt and the subway system don’t mix. We’re very concerned about the water surge in the Battery, where most of our lines go down and where the tunnels to Brooklyn go. That is one of our most low-lying areas, and we’ve boarded them up,” MTA Chairman Joe Lhota said before the floodwaters began rushing near Battery Park. “We’ve put up various different barriers to prevent the water from coming in. But that’s my biggest concern.
Officials said especially vulnerable subways lines are the A, F, 2, 3, 4, 5, N and R trains, which all run through tunnels connected to lower Manhattan. The switches are really important for controlling the flow of the subway system. They could corrode quite easily.
Storm surge and tide relative to mean low water reached a record 13.88 feet at the Battery. The previous record flood level was in the Hurricane of 1821. Flood levels are higher in Hoboken than the records also set in 1821. The full moon contributed about a foot or so to the tide records. The NY stock Exchange trading floor was reported by The Weather Channel to be under 3 feet of water. This report according the ABC TV in NYC was in error.
JFK reported a wind gust of 79mph this evening. Islip on Long Island had a gust to 90 mph earlier.
The 13.88 foot storm tide last evening just before 9 pm at the Battery was a new record, exceeding the level of 11.2 feet set in the Great Hurricane of 1821. The difference this time is that the surge came at high tide with a full moon while in 1821, amazingly the surge came at low tide.
The 1821 Hurricane was one of five known tropical cyclones that have made landfall in New York City Another, even more intense hurricane struck the region in pre-Columbian times (sometime between 1278 and 1438) and was detected by paleotempestological research.The third was the 1893 New York hurricane, the fourth was Hurricane Irene then Hurricane Sandy in 2012. Technically most of these storms touched land first elsewhere before battering the big apple.
Ironically the 1821 hurricane was the last of 5 such storms to target NYC from 1815 to 1821 during the Dalton solar minimum, a period not unlike the current period when Irene and Sandy hit in succesive years.
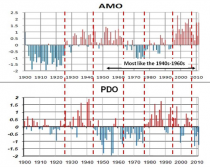
JB and I have warned that we were overdue for hurricane effects in the northeast since the AMO turned warm in 1995. A northeast hiot is more likely I had found when the PDO was also negative. This year both were the case. We are reliving the 1950s from the ocean standpoint buy the early 1800s or late 1800s and early 1900s from a solar. It is entirely possible given the AMO 70 year cycle that the early and late 1800s and early 1900 (1903) were +AMO and negative -PDO eras as well, making those decades even better analogs than the 1940s to early 1960s.
After two days of rain, a hurricane slammed into New York City on the afternoon of Monday, September 3, 1821. With the city completely unprepared for such a monstrous storm, the damage was enormous. The East and Hudson Rivers flooded over their banks, causing considerable flooding in lower Manhattan. And the hurricane force winds damaged structures throughout New York City, Brooklyn (which was still a separate city), Long Island, and New Jersey. The next day’s newspaper, the New York Evening Post of September 4, 1821, published a dramatic account of the storm, headlined “Tremendous Gale.”
The story described a storm lasting from 4:30 pm to 8:30 pm, striking with "all the violence and fury of a hurricane… throwing down chimneys, unroofing buildings, and prostrating trees in various directions."
When the gale was at its height it presented a most awful spectacle," the newspaper reported. "The falling of slate from the roofs of buildings, and broken glass from the windows, made it unsafe for any one to venture into the streets
The newspaper noted that the city had actually been fortunate, as the storm had arrived during low tide, it mentioned that the tide "rose to an unusual height, overflowing all the wharves and filling the cellars of all the stores on the margin of the East and North [Hudson] Rivers.
IT WAS THE STORM THAT CHANGED THE SCIENCE OF METEOROLOGY
A native of Connecticut, William C. Redfield grew up with a strong interest in science, and educated himself by borrowing books on scientific subjects. He was also known to be a prodigious walker, at times taking long treks from New England to visit relatives who had settled in Ohio. Following the great storm of 1821, Redfield walked through a large area of Connecticut which had been devastated by the high winds. He was intrigued to notice that in some areas the trees had been knocked down with their tops pointing to the northwest. In other areas, trees were arranged in the opposite direction, with their tops pointing to the southeast. The patterns of the battered trees convinced Redfield that hurricanes were complex circular storms, and he eventually published a paper on the topic in the American Journal of Science in 1832. Redfield's theory was that a hurricane was a great traveling whirlwind. Today we take that idea for granted, but at the time it was a new way of thinking about hurricanes. Prior to Redfield, the accepted belief was that the winds of hurricanes blew steadily from one direction.
By Joseph D’Aleo, CCM
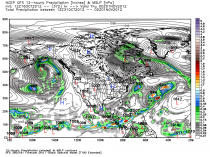
Details are still to be worked out, but a major block east of Labrador and a strong digging trough and Sandy will combine to produce hurricane force winds, heavy rains, and further west mountain snows.It is likely to hit during a full moon, when tides are near their highest, increasing the risk of coastal flooding. And because many trees still have their leaves, they are more likely to topple in the event of wind and snow, meaning there could be widespread power outages lasting to Election Day.

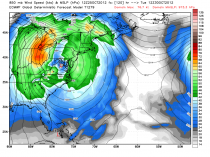
The daytime GFS model has a sub 950mb low south of Long Island in 5-6 days. The other models bring the storm back in from anywhere from the Mid Atlantic to New England. The GEM 12Z has it 952mb moving west to the coast south of Long Island. By 120 hours it is inland vertical under a deep upper low over nw New Jersey.
Snow will fall in the central Appalachians. This storm will cause significant coastal flooding and beach erosion coming near full moon and strong winds that will cause downed limbs, trees and power outages. The lack of heavy wet snow in the coastal areas and New England will men outages should be briefer.
Come to Weatherbell.com and see posts and videos and Ryan Maue’s marvelous model page. The Sandy threat was forecast weeks ago. See on the site why this pattern fits the winter pattern we have been projecting.
The European model is even further south on an Isabel like jaunt up close to Chesapeake Bay.
INSIDE EPA: Inhofe Says Post-Election EPA Rules Will Shutter Fossil Fuel Production: The report also cites promises allegedly made by former White House climate and energy czar Carol Browner to environmental supporters on a recent call telling them not to worry about the unfinished agenda because Obama is committed to the cause in a second term. “This report is a wake-up call on the economic pain that the ‘abusive’ Obama EPA plans to inflict next year,” Inhofe says. “It reveals a president who is more concerned about saving his own job than the millions of Americans who are looking for one today.” Inside EPA reported in July that EPA completed most of its controversial work early this year while killing or delaying other regulations until after the election. “ I think we all understand there are political windows that are better and others that are worse,” one environmentalist said...EPA did not respond to a request for comment. MORE A reason to cast your vote carefully.
-------------------
A new report from Senate Republicans warns that the Obama administration and the EPA are delaying implementation of painful new regulations until after the election.
The report from the Senate Committee on Environment and Public Works’ Minority Staff, “A Look Ahead to EPA Regulations for 2013,” points to a “slew of job-killing EPA regulations that the Obama-EPA has put on hold until after the election but will be on the ‘to-do’ list for 2013.”
‘As the economy has continued to falter over the past year, team Obama has been delaying rule after rule that will eliminate American jobs, drive up the price of gas at the pump even more, impose construction bans on local communities, and essentially shut down American oil, natural gas, and coal production. They don’t want this economic pain to hit American families just before the election because it would cost President Obama votes.’
The report goes on to state: ‘It’s pretty clear that if President Obama secures a second term, the Obama-EPA will have a very busy next four years, moving full speed ahead to implement numerous major rules and regulations that he has delayed or punted due to the upcoming election.
‘The radical environmental left may not need to worry, but what about American families, who are working hard in tough economic times, trying to make ends meet?
‘As the nation struggles to recover from a lagging economy in the coming year, Americans could also be grappling with a regulatory onslaught from the Obama-EPA that will strangle economic growth, destroy millions of jobs, and dramatically raise the price of goods, the cost of electricity, and the price of gas at the pump.’
The “punted” regulations include:
Greenhouse gas rules that will “virtually eliminate coal as a fuel option for future electric power generation,” and inflict new permitting costs on more than 37,000 farms.
New ozone standards that would cost $90 billion a year.
Regulations on hydraulic fracturing that will have “serious impacts on domestic energy production.”
Expansion of federal control “over virtually every body of water in the United States, no matter how small.”
Storm water regulations that could include “mandates on cities to change existing buildings, storm water sewers, and streets.”
Reductions in the sulfur content in gasoline that could boost prices by 9 cents a gallon.
Clean Water Act rules that “could require expensive new construction at power plants to lower fish deaths.” Other regulations would affect coal ash, farm dust, oil and gasoline spill prevention, and more.
“This report is a wake-up call on the economic pain that the ‘abusive’ Obama-EPA plans to inflict next year,” said Sen. James Inhofe of Oklahoma, ranking member on the committee.
“It reveals a president who is more concerned about saving his own job than the millions of Americans who are looking for one today.”
By Joseph D’Aleo
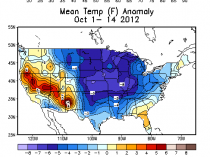
Over 3000 record lows or record low highs have occurred in the last month and over early 100 snow records for the US. A major early cold outbreak looks to be in the cards for end of the month and early November.
Ice meanwhile which rapidly diminished when a major early August storm compacted the ice is rapidly recovering.
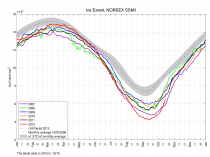
Enlarged
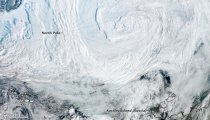
As NASA reported:
An unusually strong storm formed off the coast of Alaska on August 5 and tracked into the center of the Arctic Ocean, where it slowly dissipated over the next several days.
The Moderate Resolution Imaging Spectroradiometer (MODIS) on NASA’s Aqua satellite captured this natural-color mosaic image on Aug. 6, 2012. The center of the storm at that date was located in the middle of the Arctic Ocean.
The storm had an unusually low central pressure area. Paul A. Newman, chief scientist for Atmospheric Sciences at NASA’s Goddard Space Flight Center in Greenbelt, Md., estimates that there have only been about eight storms of similar strength during the month of August in the last 34 years of satellite records. “It’s an uncommon event, especially because it’s occurring in the summer. Polar lows are more usual in the winter,” Newman said.
Arctic storms such as this one can have a large impact on the sea ice, causing it to melt rapidly through many mechanisms, such as tearing off large swaths of ice and pushing them to warmer sites, churning the ice and making it slushier, or lifting warmer waters from the depths of the Arctic Ocean.
“It seems that this storm has detached a large chunk of ice from the main sea ice pack. This could lead to a more serious decay of the summertime ice cover than would have been the case otherwise, even perhaps leading to a new Arctic sea ice minimum,” said Claire Parkinson, a climate scientist with NASA Goddard. “Decades ago, a storm of the same magnitude would have been less likely to have as large an impact on the sea ice, because at that time the ice cover was thicker and more expansive.”
Here is what the JAMSTEC climate model suggest for this winter
Over at Weatherbell.com, Joe Bastardi and I have been blogging and doing videos on the winter and the factors involved for the US and globe. You get two cups of “Joe” for half or less the cost of one cup of coffee a day. And you get the mastery of Dr Ryan Maue with a model model page that grows daily. It alone is worth the price of admission. Here is a GFS forecast with a monstrous menacing cold high at the end of the month and the 5 day mean showing the cold extending south..
UPDATE: Live Sceince fights back; “NBC NewsClaims global warming stopped 15 years ago are based on “cherry-picked” data and don’t account for natural fluctuations in climate, according to climate scientists responding to an article that appeared Saturday (Oct. 13) in the British newspaper, The Daily Mail...Michael Mann, a climate scientist at Pennsylvania State University, called the latest story “just more dishonest cherry-picking and sleight of hand by Rose” and his go-to sources."This is just one in a continuing series of hit pieces by David Rose in The Daily Mail that completely misrepresents climate science and climate scientists. Global warming hasn’t stopped by any objective measure; it is proceeding right on schedule. In many respects (e.g. the dramatic loss of Arctic sea ice this summer), it is well ahead of schedule,” Mann told LiveScience in an email.
BUT German scientists challenge Mann’s face saving stance.
Luning/Vahrenholt Comment On HadCRUT’s 16 Years Of No Warming: “Tough Times Ahead For Climate Science”
By P Gosselin on 16. Oktober 2012
Although the silence that has spread over the mainstream media and “climate community” has been deafening, skeptic blogs on the other hand have been stepping in earnestly to inform the public on what the climate is really doing. The blogosphere has been ablaze over the last few days.
In Germany the media has been dead silent on the news that warming has stopped. There’s a simple reason for that: In Europe, good news is bad news.
Sebastian Luning and Fritz Vahrenholt have published their take on the official HadCRUT confirmation that there’s been no warming since even before Michael Mann’s infamous hockey stick fabrication was first released.
===================
New HadCRUT data confirm: global temperature has not risen in 16 years
By Dr. Sebastian Luning and Prof. Fritz Vahrenholt
(Translation/editing: Pierre Gosselin)
In the IPCC climate models, there’s only one direction projected for the future development of global temperature, namely a steady and strong increase. Also Stefan Rahmstorf of the Potsdam Institute for Climate Impact Research (PIK) shared this conviction and declared just last year in November 2011 in the Neuen Osnabrucker Zeitung:
“Global warming is galloping ahead unhindered. The temperature is increasing at a rate of between 0.16 and 0.18 C per decade.”
However, the quality of projections have to be tested using the hard data of reality. One of the most important datasets comes from the Hadley Centre of the British Met Office in cooperation with the Climate Research Unit (CRU) of the University of East Anglia. While the Hadley Centre is responsible for the sea surface temperatures, the CRU takes care of the land temperatures. Together they form the so-called HadCRUT dataset.
Recently the newest HadCRUT numbers were released; they extended up to August 2012. It turns out that everything that had been suspected was confirmed: The global temperature hasn’t risen in 16 years (see Figure below). This is a completely unexpected development when one considers how all the boldly confident forecasts from the IPCC predicted more warming.
The release of the new HadCRUT figures occurred almost in absolute silence, without any media buzz whatsoever. With some hesitation the British Daily Mail took up the topic and reported on the extension of the unhoped for temperature plateau. The report also questioned Phil Jones, the current Director of the Climate Research Unit. He confirmed the plateau and even considered it possible that it will extend even more, but only if the an El Nino does not form in the Pacific over the coming months. An El Nino would cause global temperatures to spike upwards for a short time. On the deviation between the the IPCC models and measured temperatures, Jones says:
We don’t fully understand how to input things like changes in the oceans, and because we don’t fully understand it you could say that natural variability is now working to suppress the warming. We don’t know what natural variability is doing.”
In 2009. Phil Jones had informed a colleague by e-mail that he would be concerned about the quality of the IPCC climate models if the stop in warming continued beyond 15 years. That e-mail was made public by the Climategate scandal, when an unknown hacker had breached the servers of the Climate Research Unit. The 15-year period named in that e-mail has in the meantime been surpassed. One really has got to wonder that Jones has suddenly extended his personal threshold of pain to 20 years, and now claims that phases of no warming 15-16 years long had always been expected.
Climate scientist Judith Curry, Director of Earth and Climate Sciences at Georgia Tech University, takes a more sober view. In the same Daily Mail article she says:
The new data confirms the existence of a pause in global warming. [...] Climate models are very complex, but they are imperfect and incomplete. Natural variability [the impact of factors such as long-term temperature cycles in the oceans and the output of the sun] has been shown over the past two decades to have a magnitude that dominates the greenhouse warming effect. It is becoming increasingly apparent that our attribution of warming since 1980 and future projections of climate change needs to consider natural internal variability as a factor of fundamental importance.”
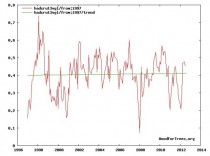
Figure 1: HadCRUT temperature data 1997 until today (red curve). The trend line (green) shows no significant increase. This temperature plateau has now been going on over 16 years. Source: Real Science based on woodfortrees.
Also Stefan Rahmstorf now appears to be worried and is desperately hoping for a trend change. Finally for 2013 he sees a new temperature record in the making; one that will hopefully break the old 1998 record. In the magazine Spektrum der Wissenschaft (also see New Scientist) Rahmstorf wrote in September 2012:
In the meantime the solar cycle is again on the rebound, and it is only a question of time before the next El Nino episode kicks in. The US NOAA has even forecast that this will occur this fall. Both of these factors together with the continuing rising greenhouse gases make it indeed probable that already 2013 could be a record year. Maybe this will mute the unscientific voices who again and again falsely claim that global warming is over.”
However, clicking on Rahmstorf’s El Nino link brings his readers back to sobriety. The acute NOAA El Nino warning has since been withdrawn and now more or less “neutral conditions” are being forecast for the northern winter of 2012/2013 in the tropical Pacific.
It’s also interesting that Rahmstorf suddenly is now increasingly emphasizing the sun, though the sun matters more for the long-term over years to decades. Speaking of solar activity, things with the upcoming solar maximum in the Spring of 2013 don’t appear to be cooperating either. The value will be considerably below the past cycles, which will tend to have more of a cooling effect than one of warming. Moreover some experts are already warning that the solar maximum of the current cycle may already be behind us(see our blog article: “Have we already missed the maximum of the current solar cycle? Asymmetry of the sun signals an extended period of low activity"). It’s quite possible that hard times lie ahead for climate science…
---------------
Global warming stopped 16 years ago, reveals Met Office report quietly released....and here is the chart to prove it
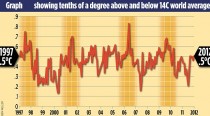
The figures reveal that from the beginning of 1997 until August 2012 there was no discernible rise in aggregate global temperatures
This means that the ‘pause’ in global warming has now lasted for about the same time as the previous period when temperatures rose, 1980 to 1996
By David Rose
The world stopped getting warmer almost 16 years ago, according to new ( non-satellite BB) data released last week.
The figures, which have triggered debate among climate scientists, reveal that from the beginning of 1997 until August 2012, there was no discernible rise in aggregate global temperatures.
This means that the ‘plateau’ or ‘pause’ in global warming has now lasted for about the same time as the previous period when temperatures rose, 1980 to 1996. Before that, temperatures had been stable or declining for about 40 years.
The new data, compiled from more than 3,000 measuring points on land and sea, was issued quietly on the internet, without any media fanfare, and, until today, it has not been reported.
This stands in sharp contrast to the release of the previous figures six months ago, which went only to the end of 2010 a very warm year.
Ending the data then means it is possible to show a slight warming trend since 1997, but 2011 and the first eight months of 2012 were much cooler, and thus this trend is erased.
Some climate scientists, such as Professor Phil Jones, director of the Climatic Research Unit at the University of East Anglia, last week dismissed the significance of the plateau, saying that 15 or 16 years is too short a period from which to draw conclusions.
Others disagreed. Professor Judith Curry, who is the head of the climate science department at America’s prestigious Georgia Tech university, told The Mail on Sunday that it was clear that the computer models used to predict future warming were ‘deeply flawed’.
Even Prof Jones admitted that he and his colleagues did not understand the impact of ‘natural variability’ - factors such as long-term ocean temperature cycles and changes in the output of the sun. However, he said he was still convinced that the current decade would end up significantly warmer than the previous two.
The regular data collected on global temperature is called Hadcrut 4, as it is jointly issued by the Met Office’s Hadley Centre and Prof Jones’s Climatic Research Unit.
Since 1880, when worldwide industrialisation began to gather pace and reliable statistics were first collected on a global scale, the world has warmed by 0.75 degrees Celsius.
Some scientists have claimed that this rate of warming is set to increase hugely without drastic cuts to carbon-dioxide emissions, predicting a catastrophic increase of up to a further five degrees Celsius by the end of the century.
The new figures were released as the Government made clear that it would ‘bend’ its own carbon-dioxide rules and build new power stations to try to combat the threat of blackouts.
At last week’s Conservative Party Conference, the new Energy Minister, John Hayes, promised that ‘the high-flown theories of bourgeois left-wing academics will not override the interests of ordinary people who need fuel for heat, light and transport energy policies, you might say, for the many, not the few’ - a pledge that has triggered fury from green activists, who fear reductions in the huge subsidies given to wind-turbine firms.
Flawed science costs us dearly
Here are three not-so trivial questions you probably won’t find in your next pub quiz. First, how much warmer has the world become since a) 1880 and b) the beginning of 1997? And what has this got to do with your ever-increasing energy bill?
You may find the answers to the first two surprising. Since 1880, when reliable temperature records began to be kept across most of the globe, the world has warmed by about 0.75 degrees Celsius.
From the start of 1997 until August 2012, however, figures released last week show the answer is zero: the trend, derived from the aggregate data collected from more than 3,000 worldwide measuring points, has been flat.
Not that there has been any coverage in the media, which usually reports climate issues assiduously, since the figures were quietly release online with no accompanying press release - unlike six months ago when they showed a slight warming trend.
The answer to the third question is perhaps the most familiar. Your bills are going up, at least in part, because of the array of ‘green’ subsidies being provided to the renewable energy industry, chiefly wind.
They will cost the average household about 100 pounds this year. This is set to rise steadily higher - yet it is being imposed for only one reason: the widespread conviction, which is shared by politicians of all stripes and drilled into children at primary schools, that, without drastic action to reduce carbon-dioxide emissions, global warming is certain soon to accelerate, with truly catastrophic consequences by the end of the century - when temperatures could be up to five degrees higher.
Hence the significance of those first two answers. Global industrialisation over the past 130 years has made relatively little difference.
And with the country committed by Act of Parliament to reducing CO2 by 80 per cent by 2050, a project that will cost hundreds of billions, the news that the world has got no warmer for the past 16 years comes as something of a shock.
It poses a fundamental challenge to the assumptions underlying every aspect of energy and climate change policy.
This ‘plateau’ in rising temperatures does not mean that global warming won’t at some point resume.
But according to increasing numbers of serious climate scientists, it does suggest that the computer models that have for years been predicting imminent doom, such as those used by the Met Office and the UN Intergovernmental Panel on Climate Change, are flawed, and that the climate is far more complex than the models assert.
‘The new data confirms the existence of a pause in global warming,’ Professor Judith Curry, chair of the School of Earth and Atmospheric Science at America’s Georgia Tech university, told me yesterday.
‘’Climate models are very complex, but they are imperfect and incomplete. Natural variability [the impact of factors such as long-term temperature cycles in the oceans and the output of the sun] has been shown over the past two decades to have a magnitude that dominates the greenhouse warming effect.
‘It is becoming increasingly apparent that our attribution of warming since 1980 and future projections of climate change needs to consider natural internal variability as a factor of fundamental importance.’
Professor Phil Jones, director of the Climate Research Unit at the University of East Anglia, who found himself at the centre of the ‘Climategate’ scandal over leaked emails three years ago, would not normally be expected to agree with her. Yet on two important points, he did.
The data does suggest a plateau, he admitted, and without a major El Nino event - the sudden, dramatic warming of the southern Pacific which takes place unpredictably and always has a huge effect on global weather - ‘it could go on for a while’.
Like Prof Curry, Prof Jones also admitted that the climate models were imperfect: ‘We don’t fully understand how to input things like changes in the oceans, and because we don’t fully understand it you could say that natural variability is now working to suppress the warming. We don’t know what natural variability is doing.’
Yet he insisted that 15 or 16 years is not a significant period: pauses of such length had always been expected, he said.
Yet in 2009, when the plateau was already becoming apparent and being discussed by scientists, he told a colleague in one of the Climategate emails: ‘Bottom line: the “no upward trend” has to continue for a total of 15 years before we get worried.’
But although that point has now been passed, he said that he hadn’t changed his mind about the models’ gloomy predictions: ‘I still think that the current decade which began in 2010 will be warmer by about 0.17 degrees than the previous one, which was warmer than the Nineties.’
Only if that did not happen would he seriously begin to wonder whether something more profound might be happening. In other words, though five years ago he seemed to be saying that 15 years without warming would make him ‘worried’, that period has now become 20 years.
Meanwhile, his Met Office colleagues were sticking to their guns. A spokesman said: ‘Choosing a starting or end point on short-term scales can be very misleading. Climate change can only be detected from multi-decadal timescales due to the inherent variability in the climate system.’
He said that for the plateau to last any more than 15 years was ‘unlikely’. Asked about a prediction that the Met Office made in 2009 - that three of the ensuing five years would set a new world temperature record - he made no comment. With no sign of a strong El Nino next year, the prospects of this happening are remote.
Why all this matters should be obvious. Every quarter, statistics on the economy’s output and models of future performance have a huge impact on our lives. They trigger a range of policy responses from the Bank of England and the Treasury, and myriad decisions by private businesses.
Yet it has steadily become apparent since the 2008 crash that both the statistics and the modelling are extremely unreliable. To plan the future around them makes about as much sense as choosing a wedding date three months’ hence on the basis of a long-term weather forecast.
Few people would be so foolish. But decisions of far deeper and more costly significance than those derived from output figures have been and are still being made on the basis of climate predictions, not of the next three months but of the coming century - and this despite the fact that Phil Jones and his colleagues now admit they do not understand the role of ‘natural variability’.
The most depressing feature of this debate is that anyone who questions the alarmist, doomsday scenario will automatically be labelled a climate change ‘denier’, and accused of jeopardising the future of humanity.
So let’s be clear. Yes: global warming is real, and some of it at least has been caused by the CO2 emitted by fossil fuels. But the evidence is beginning to suggest that it may be happening much slower than the catastrophists have claimed a conclusion with enormous policy implications. More.
HADCRUT4 and Met Office Claims
UPDATE
Read this article: Met Office reply to David Rose Sunday Mail article:
“As we’ve stressed before, choosing a starting or end point on short-term scales can be very misleading. Climate change can only be detected from multi-decadal timescales due to the inherent variability in the climate system. If you use a longer period from HadCRUT4 the trend looks very different. For example, 1979 to 2011 shows 0.16C/decade (or 0.15C/decade in the NCDC dataset, 0.16C/decade in GISS). Looking at successive decades over this period, each decade was warmer than the previous so the 1990s were warmer than the 1980s, and the 2000s were warmer than both.”
Ok, let’s look at a non-arbitrary endpoint (the last datapoint) and go back in 5 year increments.
HADCRUT4 Last 5 years colder than previous 5 years
Mean of the anomaly of the last 5 years = .45C
Mean of the anomaly of the previous 5 years = .49C
Mean of the anomaly of the previous previous 5 years = .41C
HADCRUT3 Last 5 years colder than previous AND colder than the previous previous 5.
Mean of the anomaly of the last 5 years = .39C
Mean of the anomaly of the previous 5 years = .45C
Mean of the anomaly of the previous previous 5 years = .41C
Warming stopped. HADCRUT3 trend is negative.
IPCC predicted .2C per decade. HADCRUT4 has been created to change the negative trend of HADCRUT3 to a positive one.
But even with the “adjustments”, the last 15 years trend in HADCRUT4 is 1/6th that predicted by the IPCC.
On August 24th, the UK Met Office issued their 3-month outlook, which forecast
SUMMARY: TEMPERATURE: The balance of probabilities suggests that September will be slightly warmer than average.
It will therefore have come as no surprise that September in the UK turned out much colder than normal, in fact 0.7C colder than the 1981-2010 baseline, and the coolest since 1994. Incidentally, the CET numbers suggest the YTD figure is running close to the 30 year average for the year as a whole.
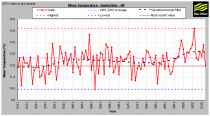
Still, maybe they fared better with their rainfall forecast.
SUMMARY: PRECIPITATION: For UK averaged rainfall the predicted probabilities weakly favour below normal values during September.
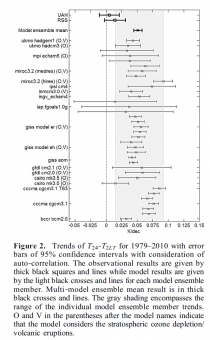
Woops! Rainfall was 17% above normal!
With this level of competence, do they seriously expect us to believe their predictions for the end of the century?
By the way, while we are looking at September’s weather, I really cannot allow the Huff Post to get away with the drivel that they print. They claimed that
Britain has been hit with the most extreme September weather for decades, with hundreds evacuated from their homes and fire and rescue teams battling against the floods to help residents of some of the worst-hit areas.
According to Philip Eden, one of the UK’s best known meteorologists, the heaviest rainfall recorded was 131mm over three days at Ravensworth, N Yorks. He points out that exactly the same amount of rain fell in a storm in September last year, although this was in the Scottish Highlands, where less damage was caused.
We can find a similar event in England in September 2008. As the Met Office map below shows, three day rainfall was greater and more extensive, with areas of Northumberland exceeding 150mm ( see table here).
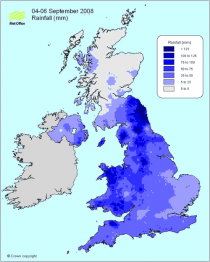
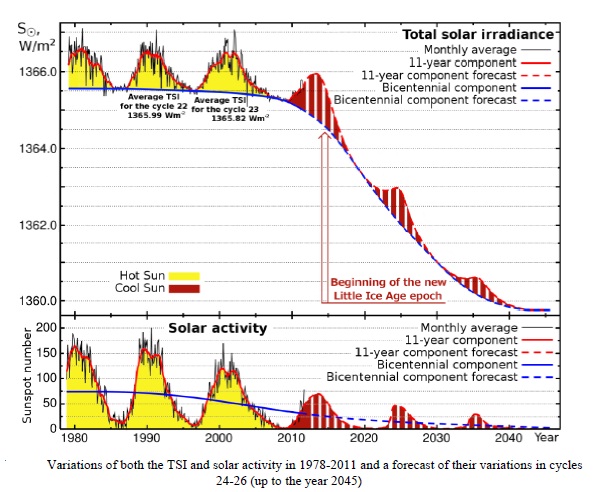
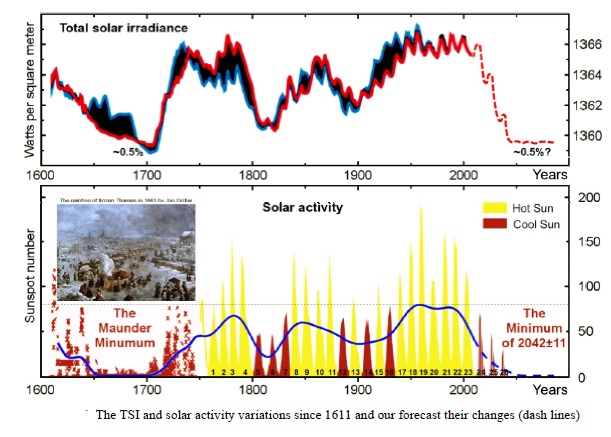
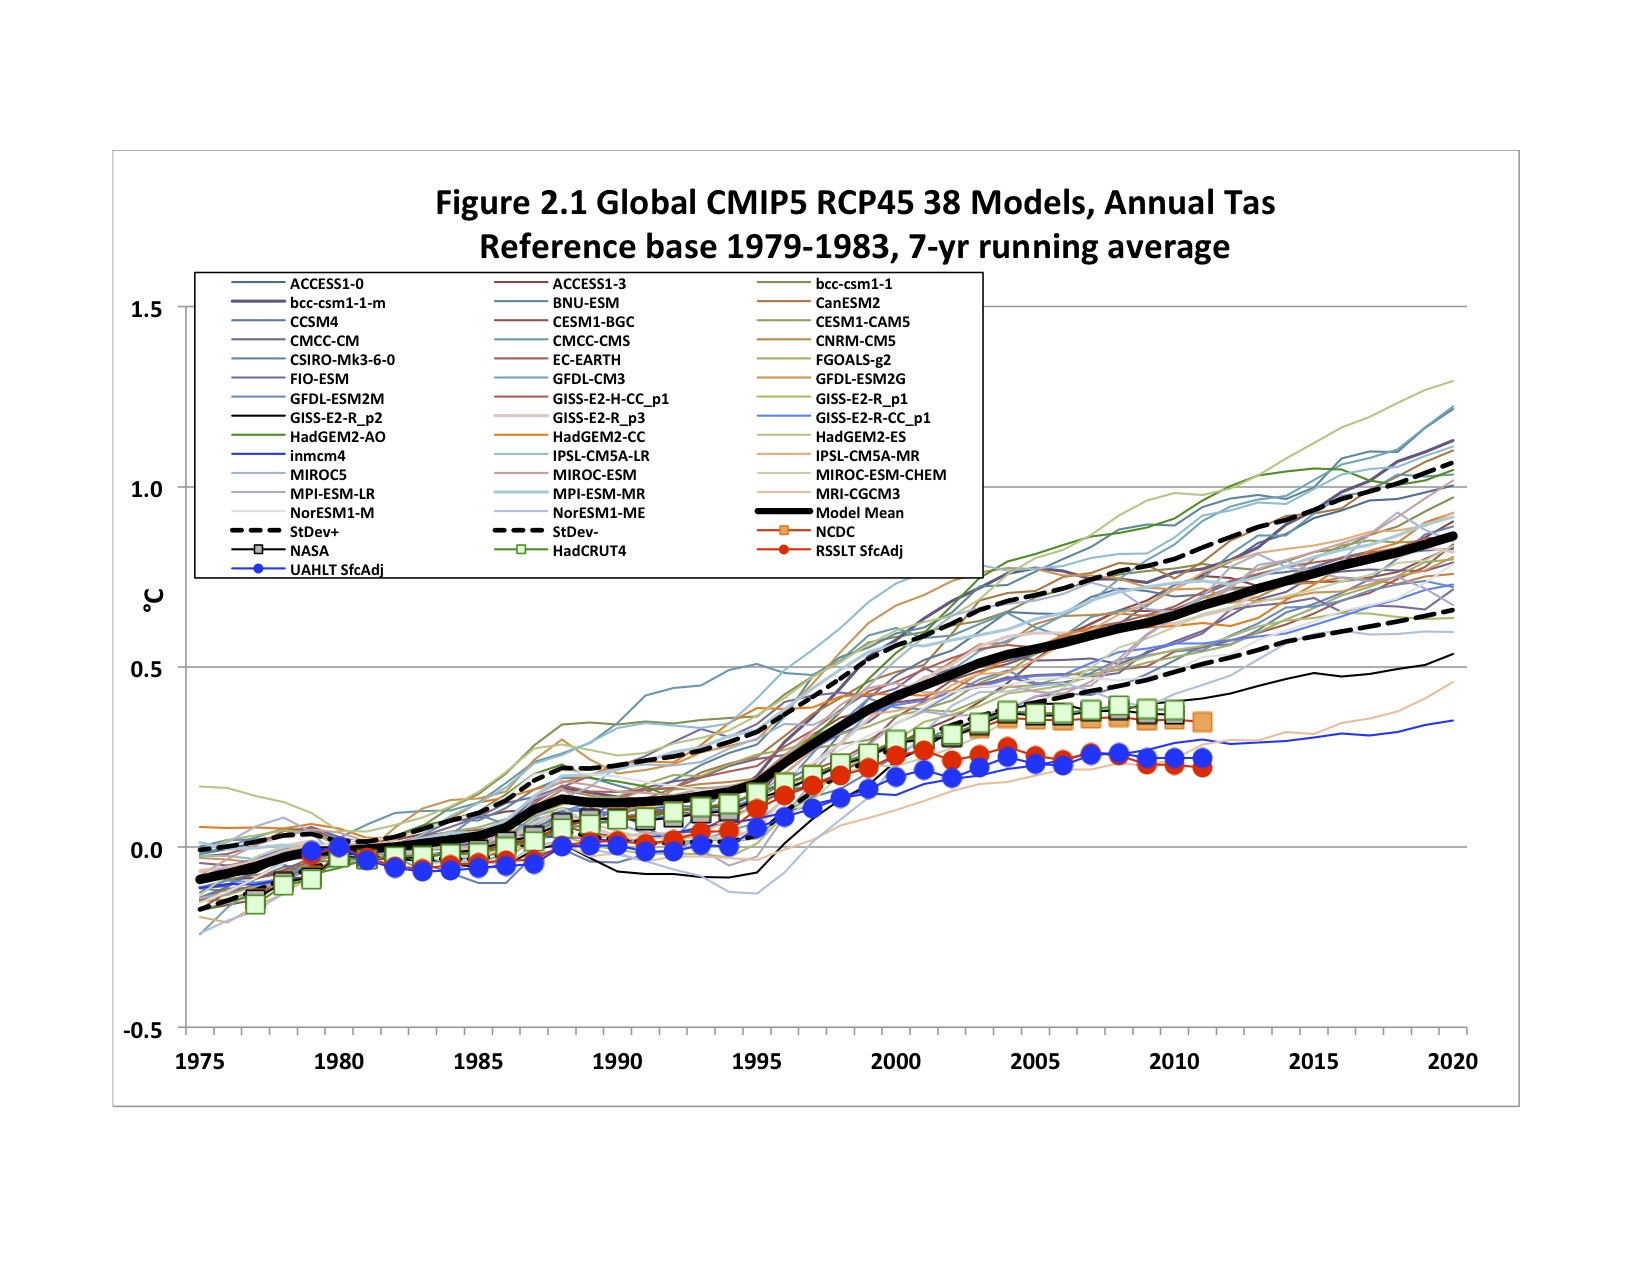
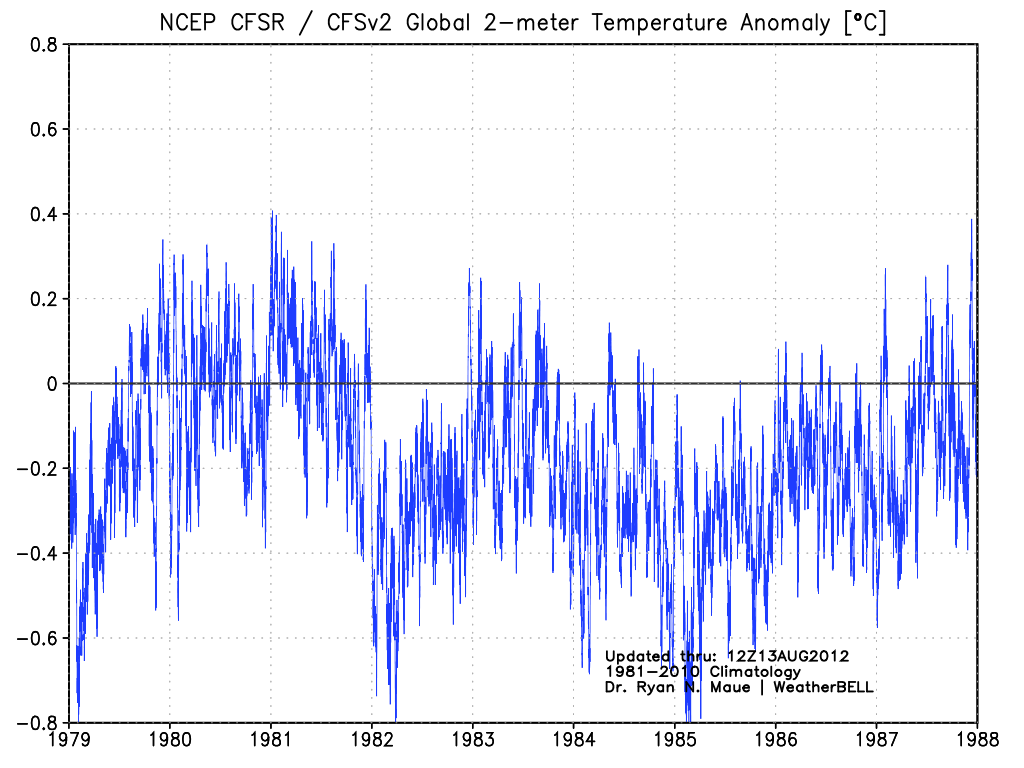
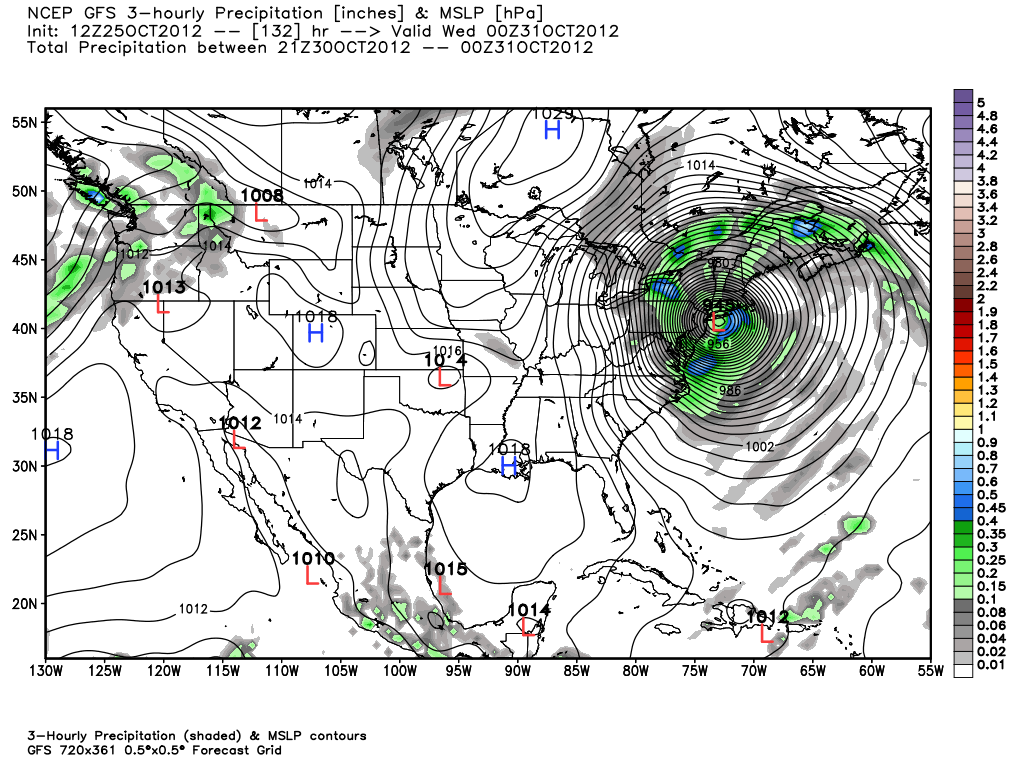
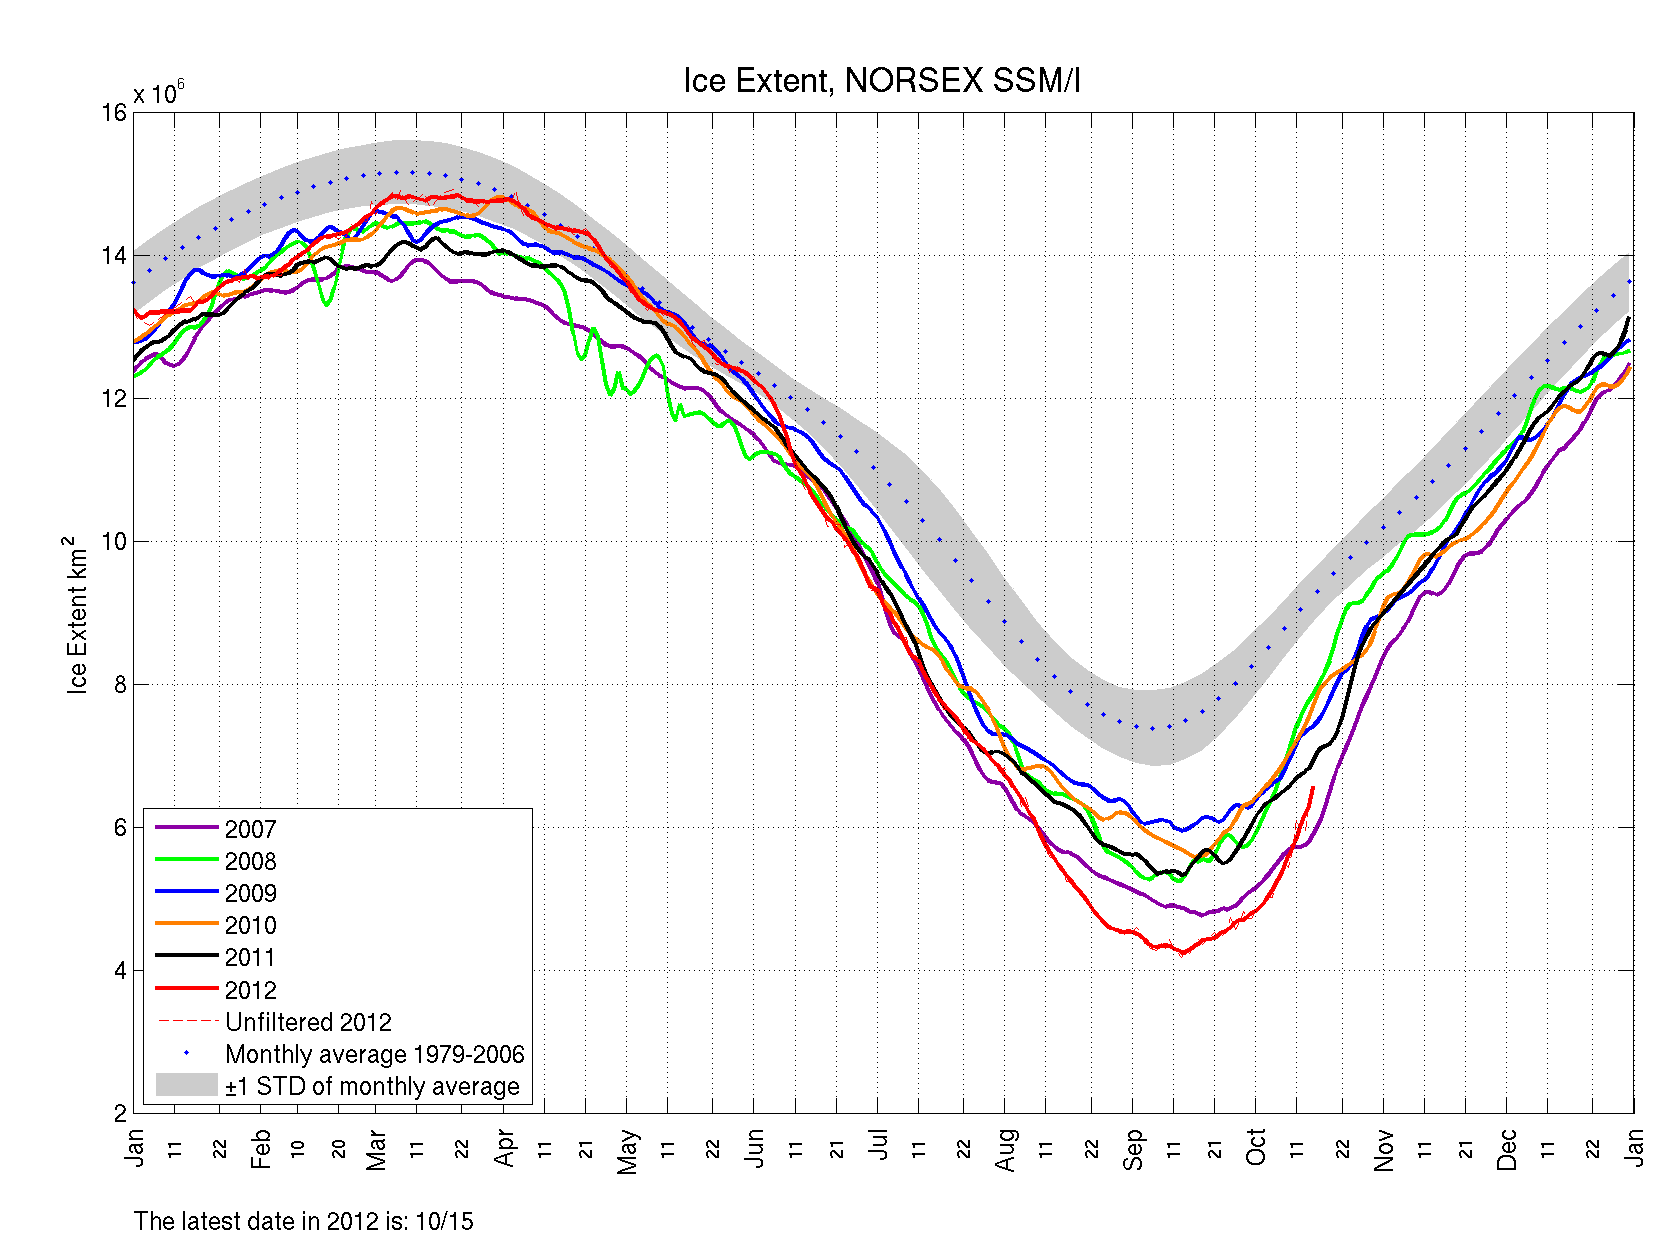
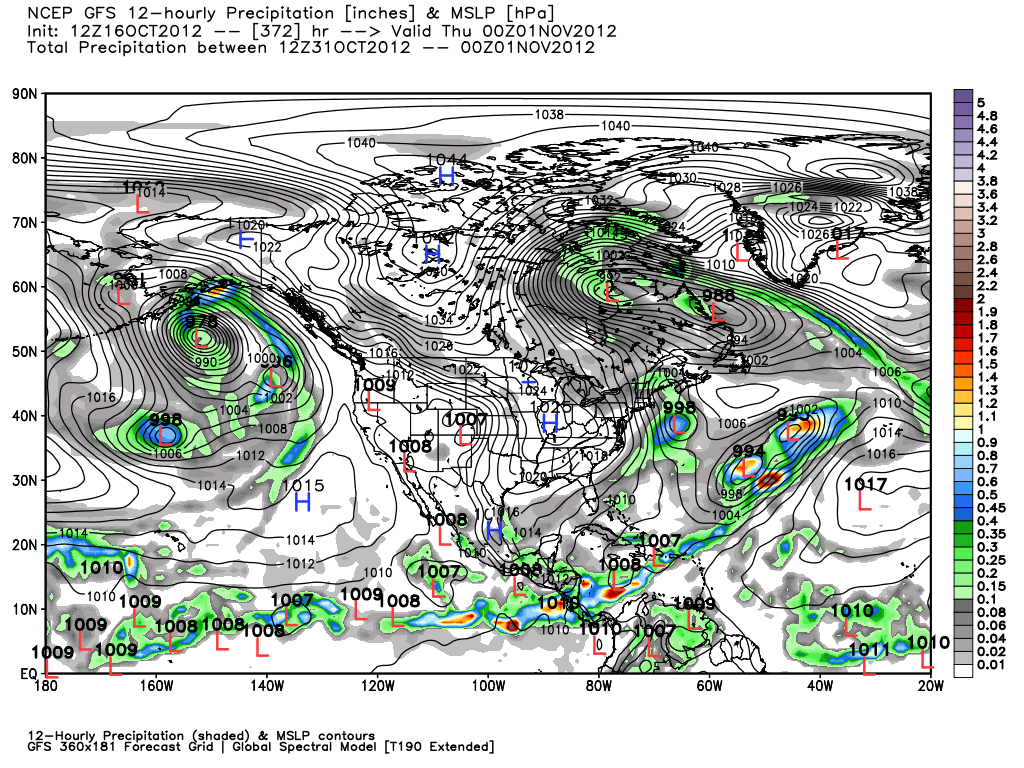
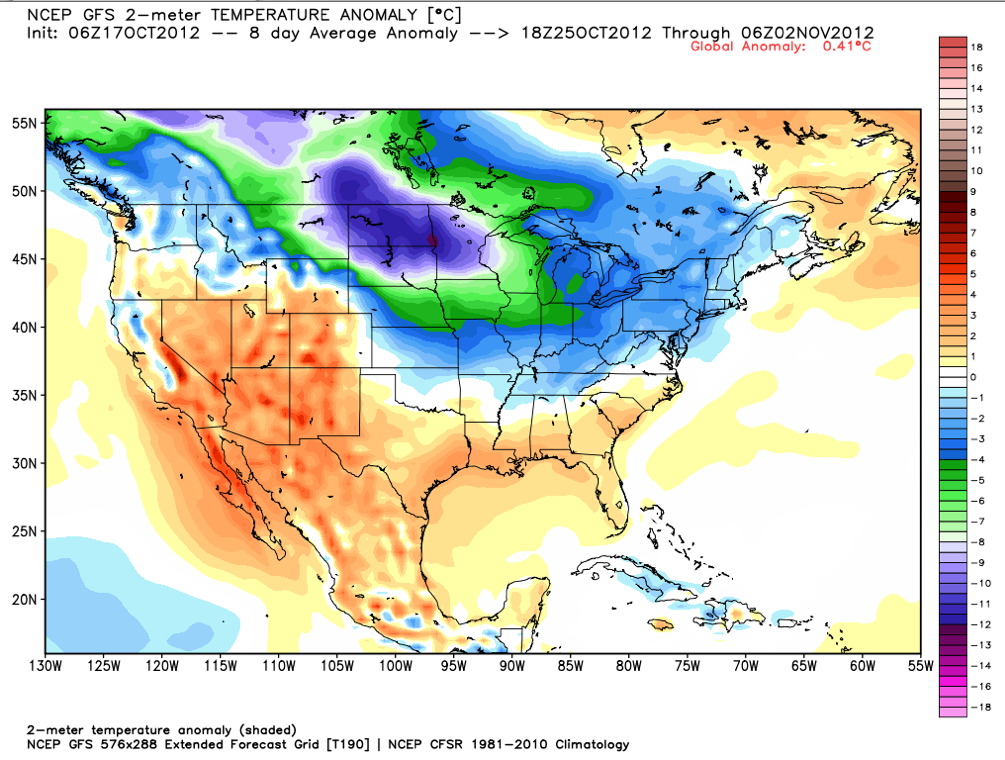
And if you really want an example of extreme September weather, you need to go back to 1968, which Philip Eden describes as “probably the most severe inland flood to hit the Home Counties in the last 100 years”. According to Eden, “a sizeable area covering much of Surrey, west Kent, southeast London and south Essex was deluged with more than 150mm of rain, and two rainfall-recording sites in Essex - Tilbury and Stifford - received slightly more than 200mm, which is more than they had had during the whole of the summer quarter.”
Still, when did the Huff let facts get in the way of a bit of propaganda?